
Influence of the Planned Hospital Reform on Accessibility
Source title image: Screenshot of https://www.zeit.de/gesundheit/2023-06/notfallversorgung-krankenhaus-reform-notfallstufe-karte
Content
Background
Last year, Julius Tröger approached me and informed me about the ongoing discussion regarding the hospital reform in Germany. We already knew each other from a joint project for ZeitOnline, where we calculated the accessibility of vaccination centers for various scenarios1. Yes, 2021 was a crazy year. Now… since the workflow for examining hospital accessibility is very similar, if not identical, it quickly became clear that we would collaborate again this time.
Technical Background
In the context of my hopefully soon-to-be-completed dissertation, I parameterized a Europe-wide road network model using so-called Floating Car Data2 for specific network states. These network states are based on peak traffic times – a morning and an afternoon period of 4-5 hours each – rather than the peak hour when everyone is stuck in traffic. Since peak traffic times vary depending on the location – in rural areas, they typically start earlier than in urban areas, due to the origins (morning: residential areas) and destinations (morning: workplaces or educational institutions). But that might be getting too detailed for understanding here.
I then benchmarked the results of my work against Google and other companies for 20,000 relations provided by Friedrich et al. 3. The results show a good match, even better than the comparison between TomTom and Google in the provided dataset. The network model reflects the status of December 2017 and is based on the network graphs of OpenStreetMap. Once the dissertation is completed, it will also be made accessible to third parties.
Hospitals as well as residential buildings are sometimes connected by small access roads or private streets, which may even be one-way streets. Since my work focuses on the classified network, inconsistencies here (such as incorrectly labeled one-way streets) can lead to glitches. he same applies to the connection of islands, as ferry travel times were not included in the model. However, in case of an emergency, the deployment of a rescue boat or helicopter is to be expected. In the evaluations of car travel time distribution to the hospitals, these glitches do not significantly impact the results.
In the network model, only car travel time is considered, meaning that the time losses for access and egress as well as parking search are yet to be applied (there are rough guidelines for this in the guidelines for integrated network design of the FGSV; unfortunately still closed source4).
The car travel time primarily reflects one’s own journey to a hospital. However, it also serves as a proxy for traffic flow, such as at intersections. If an intersection is congested, it also means a time loss for emergency vehicles. Using this proxy allows for fair comparisons between regions. Since representing travel times of emergency vehicles is quite complex, it is likely that accessibility thresholds will be based on car travel time.
The final dataset includes travel times from all inhabited 100m grid cells (Zensus 20115) to all (researched) hospitals in Germany.
First hospital dataset
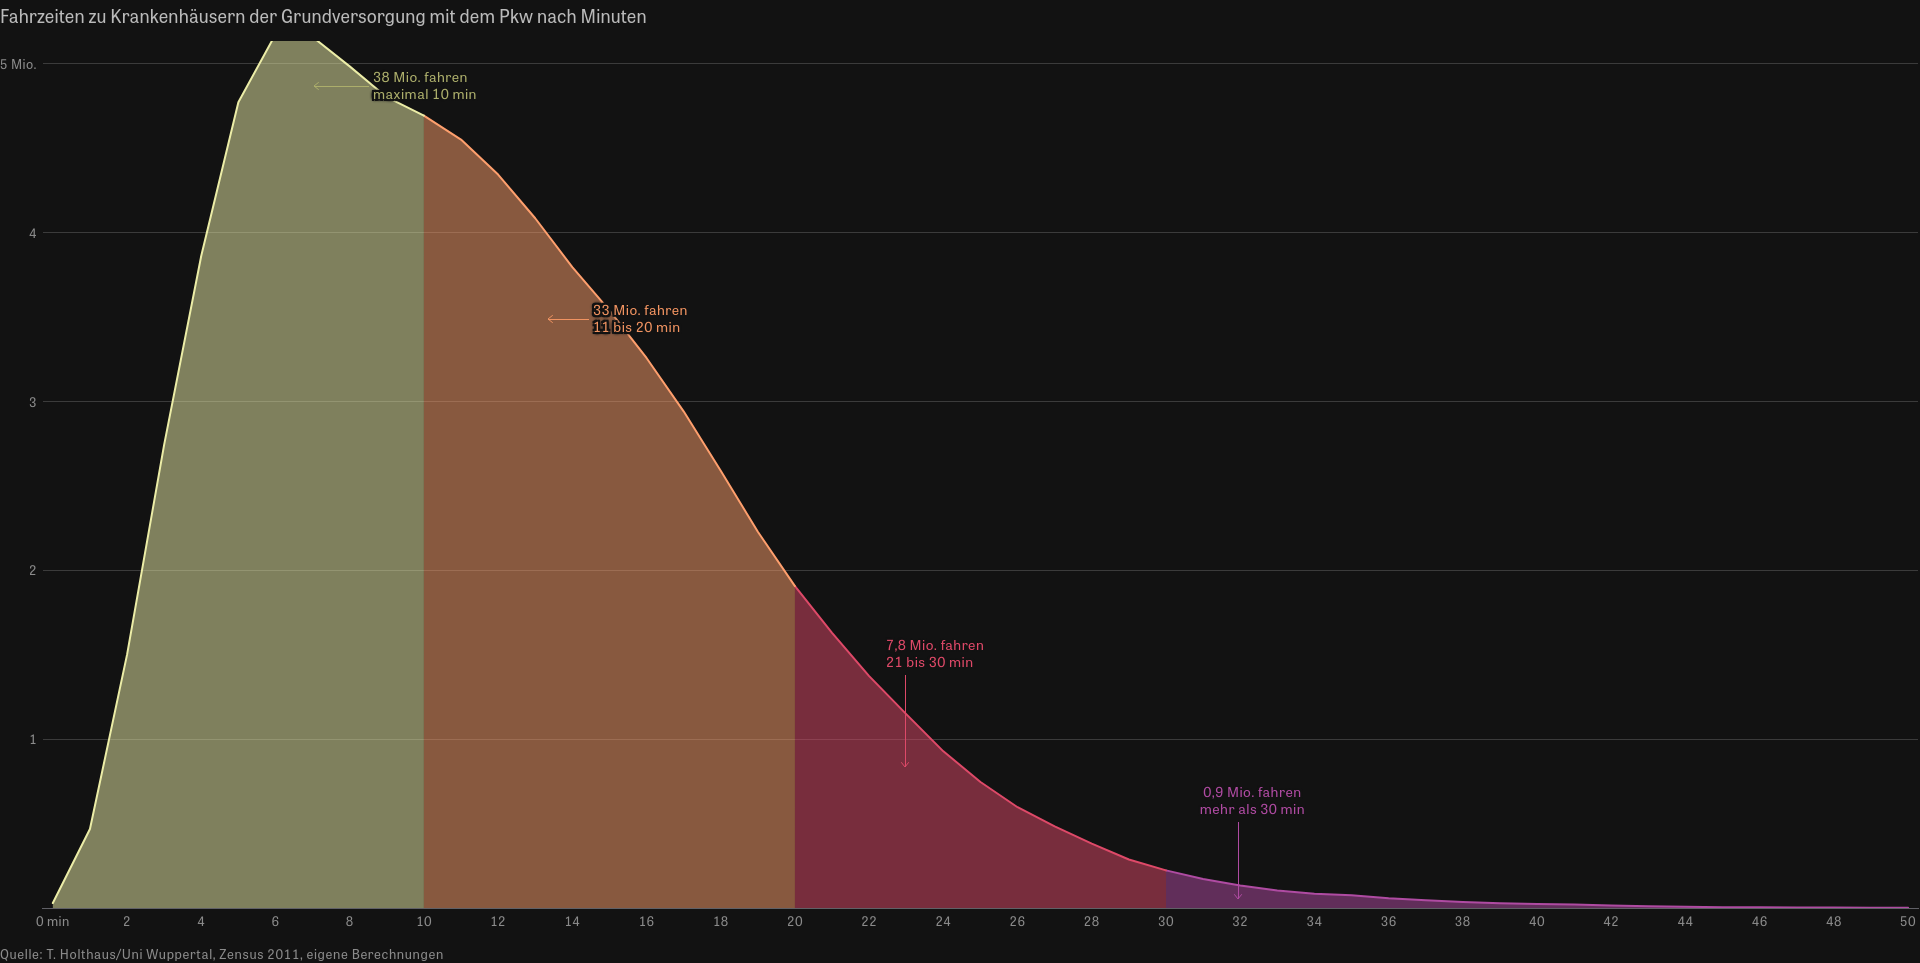
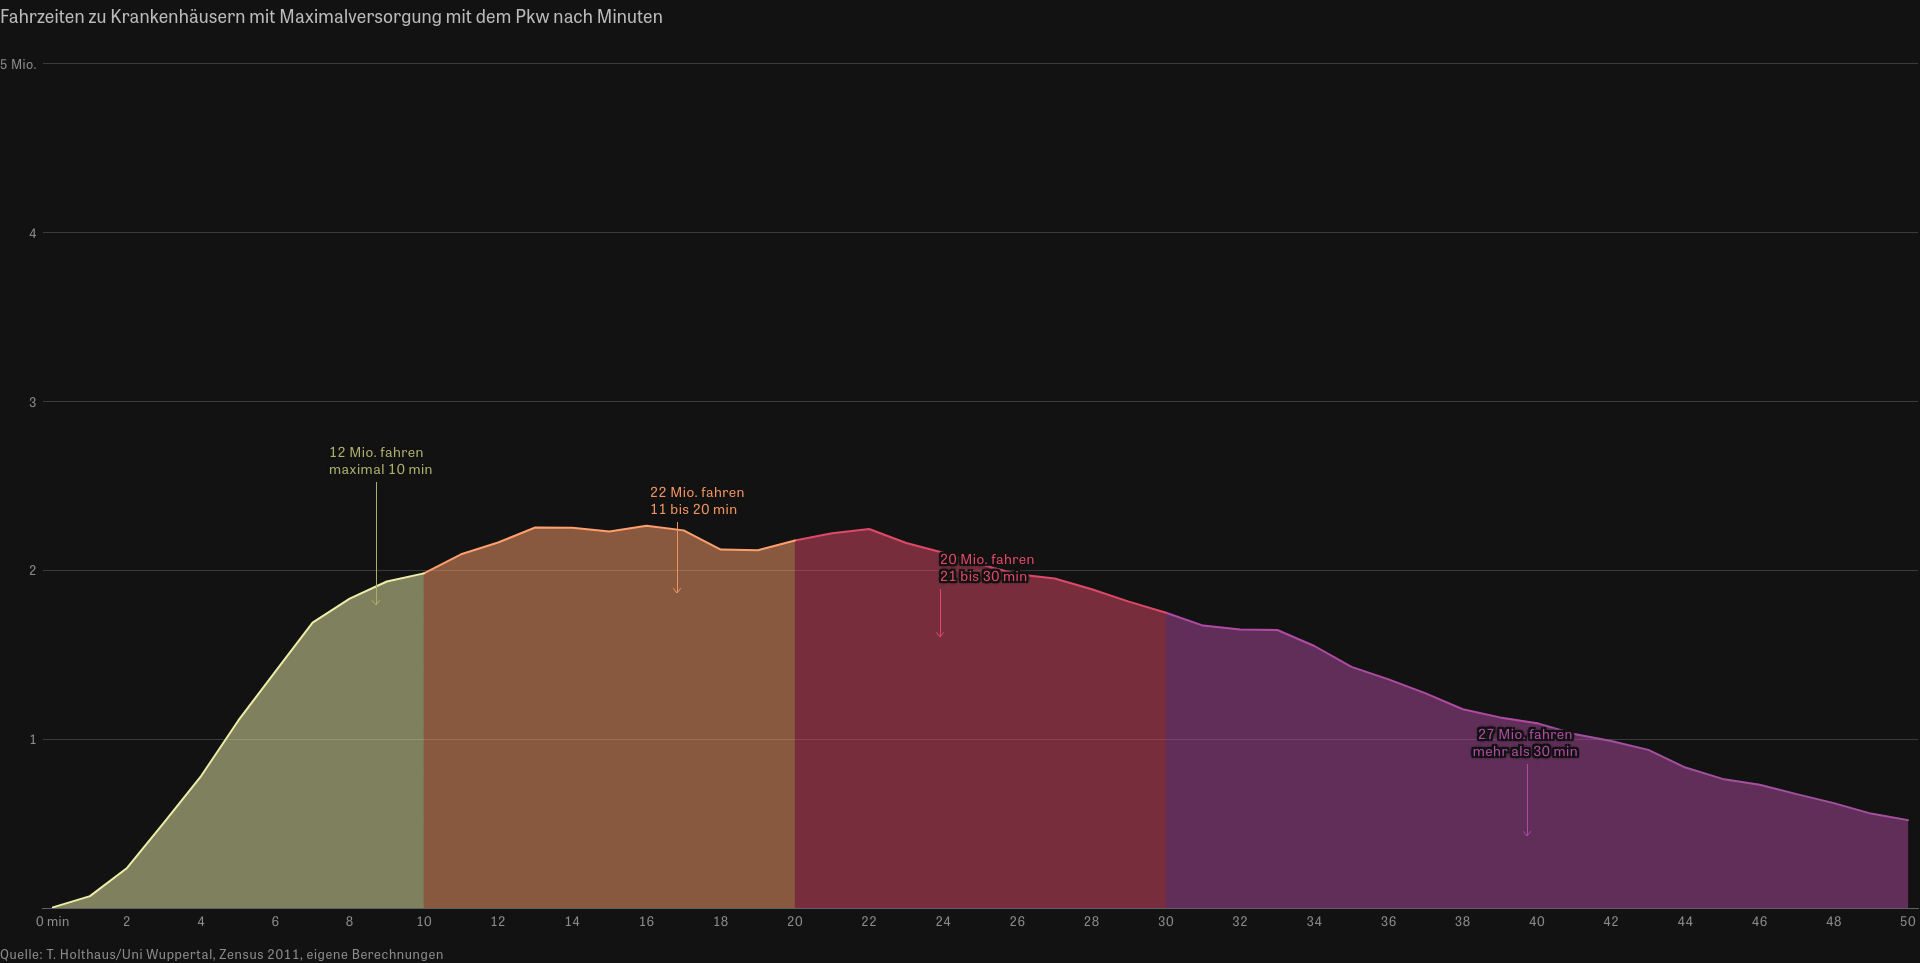
On June 29, 2023, the article with the results was online (ZeitOnline article). In the implemented visualization, entire Germany is shown as a dynamic map, and if necessary, any location can be specified for zooming. The three ACTUAL situations for basic care, extended care, and maximum care are displayed either as an infobox or optionally as isochrones at the level up to the 100m grid. For each level of care, the travel time to the nearest hospital of that emergency level is calculated, with a hospital of maximum care also providing basic care.
Alongside the map, car travel time distributions of the total population to each emergency level are presented, as well as aggregated population-weighted travel times by federal state and district/county. Assuming a threshold of 30 minutes for adequate accessibility, I find it particularly alarming that approximately 27 million inhabitants (based on the 2011 census) require more than 30 minutes to reach a maximum care hospital. Even extended care is not accessible within 30 minutes for about 11 million inhabitants. However, for basic care, it’s only about 0.9 million inhabitants.

Basic care; source: https://www.zeit.de/gesundheit/2023-06/notfallversorgung-krankenhaus-reform-notfallstufe-karte Extended care; source: https://www.zeit.de/gesundheit/2023-06/notfallversorgung-krankenhaus-reform-notfallstufe-karte Maximum care; source: https://www.zeit.de/gesundheit/2023-06/notfallversorgung-krankenhaus-reform-notfallstufe-karte

After the article had been online for a while, it became apparent that the constructed database of hospitals, mostly sourced from the quality reports of hospitals (Gemeinsamer Bundesausschuss; database query at the end of May 20236), included already closed hospital locations or did not yet include new locations.
At that time, no scenarios for the hospital reform were foreseeable, which is why only the current state could be depicted. However, this changed over time.
First hospital dataset – new stakeholders
A few days after the publication on ZeitOnline, I received several inquiries, including a promising one from Lars Koppers of the Science Media Center (website). The SMC is a non-profit institution that engages in data journalism and processes scientific content for media creators free of charge.
And here begins the journey of further analyses and tools, about which I will report more soon. – May 4th, 2024.
Closing remarks
I thank Julius Tröger and his team, Lars Koppers and his team, as well as all individuals involved in the research and compilation of the database for their excellent collaboration.
Publications
Science Media Center: Schlaganfallversorgung in Deutschland: Interaktive Karten zu Stroke Units und Fahrzeiten. Calculation of travel times and distances based on the 100m grid (GeoGrid) of the 2022 Census, 20.11.2024.
Media reactions:
- https://www.spiegel.de/gesundheit/so-schnell-werden-sie-bei-einem-schlaganfall-in-deutschland-versorgt-a-818646c0-ff15-4577-a94e-85b932d79960
- https://www.focus.de/gesundheit/news/deutschlandkarte-zeigt-so-lange-dauert-es-an-ihrem-wohnort-bis-sie-bei-schlaganfall-versorgt-werden_id_260499130.html
- https://www.welt.de/gesundheit/article254617660/Krankenhausreform-Riskiert-Lauterbach-die-Schlaganfall-Versorgung.html
- https://www.fr.de/wissen/jede-minute-zaehlt-nach-einem-schlaganfall-erhebliche-regionale-differenzen-bis-zur-naechsten-stroke-unit-93424938.html
- https://rp-online.de/nrw/staedte/viersen/kreis-viersen-wo-die-fahrt-fuer-schlaganfall-patienten-zur-stroke-unit-am-laengsten-dauert_aid-121352697
- https://www.aerzteblatt.de/nachrichten/155830/Stroke-Units-in-den-meisten-Regionen-gut-erreichbar
- https://www.apotheken-umschau.de/news/klinikreform-der-weg-zur-schlaganfall-behandlung-wird-laenger-1194121.html
- https://www.apotheke-adhoc.de/nachrichten/detail/panorama/bessere-schlaganfallversorgung-moeglich/
- https://www.aerztezeitung.de/Politik/Studie-Konzentration-der-Schlaganfallversorgung-verlaengert-Fahrtzeiten-geringfuegig-454551.html
- https://www.pharmazeutische-zeitung.de/bessere-versorgung-bei-kaum-laengeren-fahrzeiten-151492/
- https://www.mittelhessen.de/politik/politik-deutschland/klinikreform-so-viel-laenger-koennte-die-rettungsfahrt-dauern-4159791
- https://www.main-echo.de/region/stadt-kreis-aschaffenburg/schneller-versorgen-bei-schlaganfall-art-8403011
- https://www.stimme.de/heilbronn/landkreis-heilbronn/medizin-schlaganfall-versorgung-hilfe-heilbronn-hohenlohe-rettungsdienst-fahrtzeit-art-4991004
- https://www.schlaganfall-hilfe.de/de/aktuelles/2024/versorgung-flaechendeckend
- https://www.mdr.de/wissen/medizin-gesundheit/schlaganfall-transport-krankenhaus-stroke-unit-sachsen-anhalt-thueringen-100.html
- https://www.ndr.de/nachrichten/info/Schlaganfall-So-schnell-werden-Patienten-im-Norden-versorgt,schlaganfallversorgung100.html
- https://www.ihre-vorsorge.de/gesundheit/nachrichten/schlaganfall-bessere-versorgung-bei-kaum-laengeren-fahrtzeiten-moeglich
- https://rp-online.de/nrw/staedte/krefeld/krefeld-gute-werte-bei-versorgung-von-schlaganfall-patienten_aid-121347573
- https://katapult-mv.de/artikel/besser-keinen-schlaganfall-in-dranske/
- https://www.tagesspiegel.de/gesundheit/jede-minute-zahlt–und-der-wohnort-berlins-beste-kliniken-fur-einen-schlaganfall-12739526.html
- https://biermann-medizin.de/klinikreform-94-prozent-der-schlaganfall-patienten-erreichen-stroke-unit-in-30-minuten/
- https://www.adac.de/gesundheit/krankheiten/schlaganfall-vorbeugung-ursachen/
- https://www.augsburger-allgemeine.de/bayern/schlaganfall-so-lange-benoetigt-der-rettungsdienst-in-ihrer-gemeinde-103671999
- https://www.wp.de/sauer-und-siegerland/article407758296/schlaganfall-so-weit-ist-es-in-suedwestfalen-zur-fachklinik.html
- https://www.haz.de/lokales/hannover/schlaganfall-in-hannover-so-lang-sind-die-wege-in-die-stroke-unit-NFLKMROCA5HTVFODFNESDG3YD4.html
- https://www.allgaeuer-zeitung.de/weiler/warum-das-westallgaeu-bei-der-schlaganfallversorgung-hinterherhinkt-eine-auswertung-103666682
- https://www.sn-online.de/lokales/schaumburg/schlaganfall-in-schaumburg-so-lang-sind-die-wege-in-die-stroke-unit-FD6GAQ45RFHAZAVMATWXRDKTHE.html
- https://www.n-tv.de/wissen/Schlaganfall-Patienten-koennten-besser-versorgt-werden-article25380697.html
- https://deutsch.medscape.com/artikelansicht/4914443?form=fpf
- https://www.medconweb.de/blog/qualitaet/schlaganfallversorgung-stroke-units-neue-daten-zur-erreichbarkeit-in-deutschland/
- ZeitOnline. Das große Impfversprechen. https://www.zeit.de/politik/2021-03/corona-impfungen-bundesregierung-buerokratie-datenschutz-deutschland-strategie?, last checked May 4th, 2024 ↩
- For more see https://en.wikipedia.org/wiki/Floating_car_data, last checked May 4th, 2024 ↩
- Friedrich, Markus; Bawidamann, Jürgen; Peter, Lars. Methoden zur Bewertung der Verbindungsqualität in Straßennetzen. https://bast.opus.hbz-nrw.de/opus45-bast/frontdoor/deliver/index/docId/2765/file/V368+Gesamtversion+BF.pdf, last checked May 4th, 2024 ↩
- For more see https://www.fgsv-verlag.de/rin, last checked May 4th, 2024 ↩
- For more see https://www.zensus2011.de/DE/Home/Aktuelles/DemografischeGrunddaten.html, last checked May 4th, 2024 ↩
- For more see https://www.g-ba.de/themen/qualitaetssicherung/datenerhebung-zur-qualitaetssicherung/datenerhebung-qualitaetsbericht/, last checked May 4th, 2024 ↩